Projects
I have completed many projects over the years! The following are the ones I’m the most proud of and feel are the ones I should display. My current projects include: magnetar wind simulations in Athena++, pressure-driven wind numerical analyses, and Lattice Boltzmann Method (LBM) of computational fluid dynamics on GPUs.
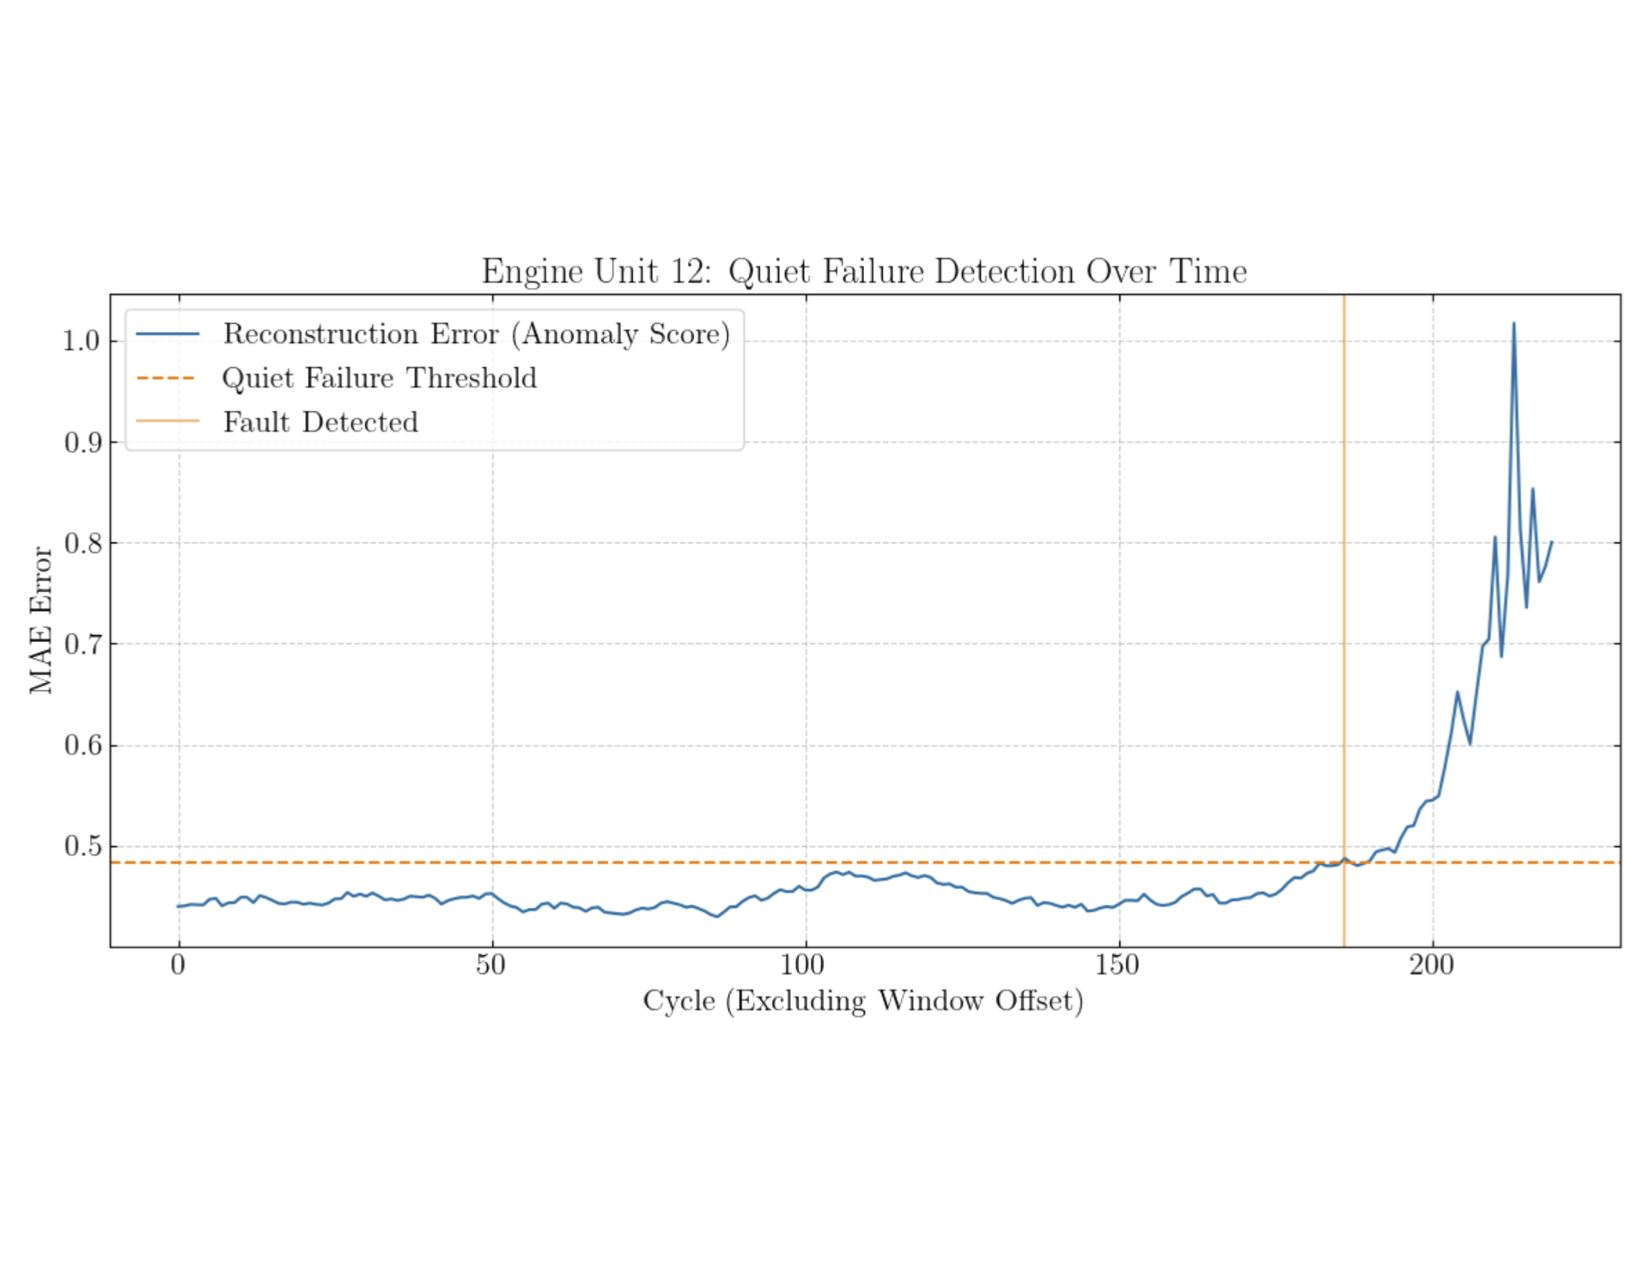
Jet Engine Fault Detection
Unsupervised LSTM autoencoder for jet engine fault detection. Continue reading Jet Engine Fault Detection
CURE: Traceback of IC4665 Cluster
Crude traceback of the IC4665 cluster with in-notebook HTML animations in Python. Continue reading CURE: Traceback of IC4665 Cluster
Kapitza Pendulum Analysis
Analytical and numerical analysis of a Kapitza pendulum system in Python and Manim. Continue reading Kapitza Pendulum Analysis

MHN Regression for the ISS
Multi-headed network built on MobileNetV3Small to regress ISS docking port location, with STL visualization. Continue reading MHN Regression for the ISS
Dementia Classification AI
Using stacked 3D MRI tensors to train a GPU-accelerated functional 3D CNN model for dementia classification. Continue reading Dementia Classification AI
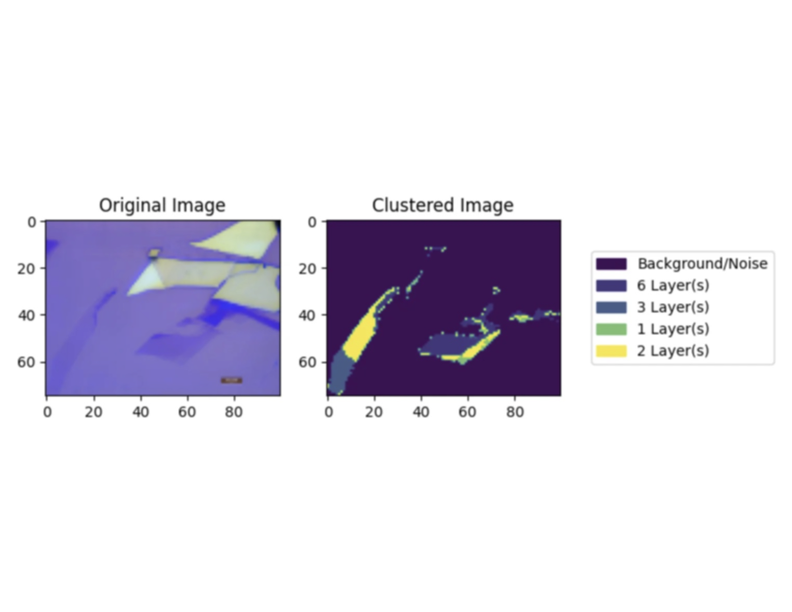
Automated Graphene Clustering
Graphene sample identification through binary CNN and unsupervised clustering of graphene layers on a substrate. Continue reading Automated Graphene Clustering
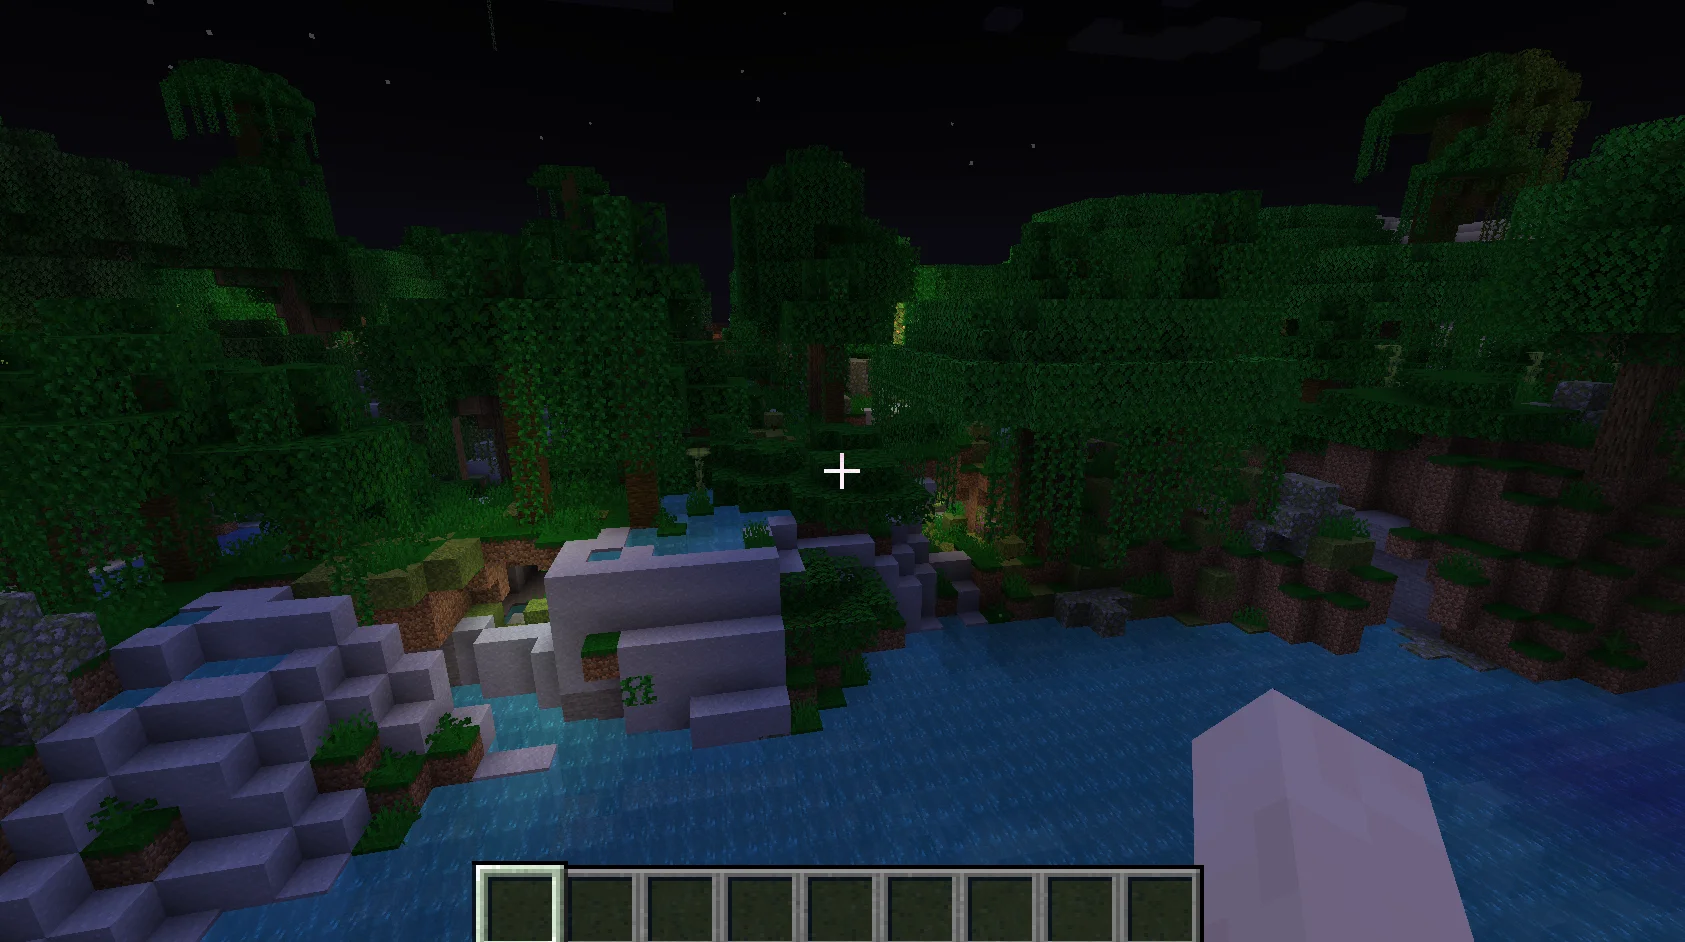
Chocolate
Custom-implemented behavior and additions to Minecraft via FabricAPI, TerraBlender, and Gradle. Continue reading Chocolate
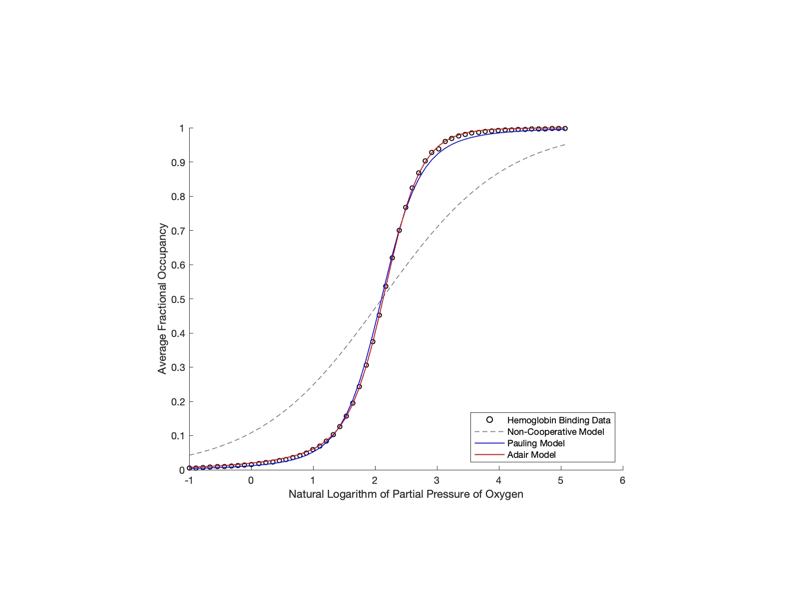
Hemoglobin Cooperativity
Parameter fitting and Monte Carlo simulations of varying hemoglobin cooperativity models. Continue reading Hemoglobin Cooperativity

PandoraPvP
Optimizied Spigot plugins for a designated modded public Minecraft server. Continue reading PandoraPvP
